Obesity statistics UK 2025

Obesity is a growing concern across the UK, affecting both adults and children. It’s linked to a wide range of health and sociological conditions, from type 2 diabetes to depression, and it places significant pressure on the NHS.
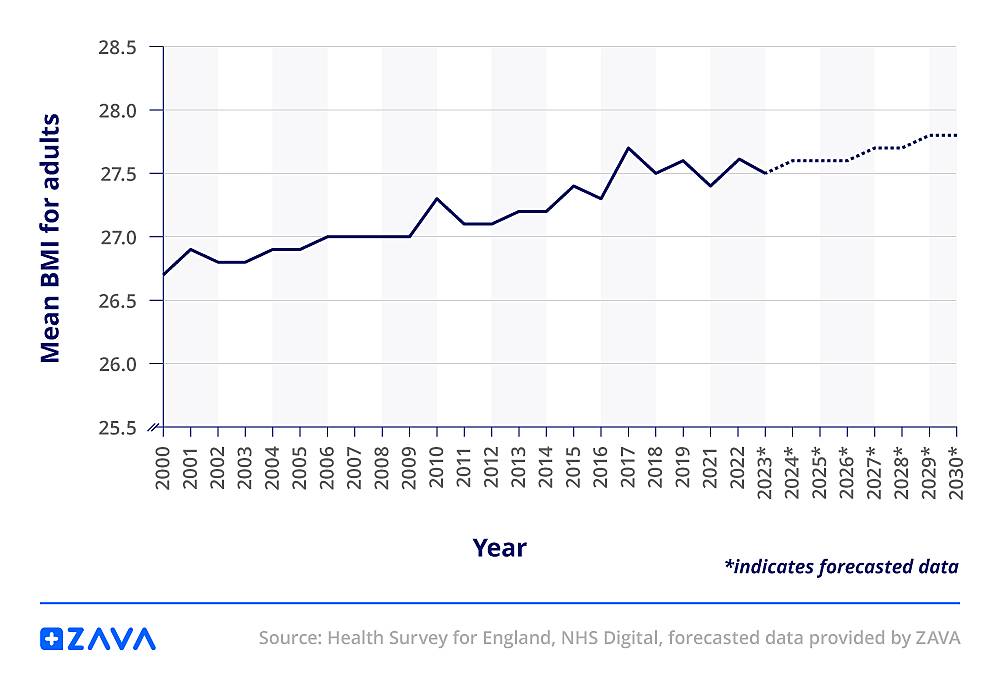
64.5% of adults aged 18 and over in England were estimated to be overweight or living with obesity as of 2023-2024, according to the Office for Health Improvement and Disparities, part of the Department of Health and Social Care. Looking ahead, forecasted data provided by ZAVA suggests the average UK adult BMI will rise to 27.8 by 2030, highlighting an upward increase. Childhood obesity rates are also rising in many areas, with growing attention on how early habits and socioeconomic status play a part.
We’ll explore the most recent obesity statistics for 2025, including key facts about obesity in the UK and around the world. You’ll find insights into long-term trends, regional differences, BMI projections, and how obesity impacts different demographics to better understand what is happening and why it matters.
Top 10 must-know obesity statistics 2025
- In 2022, over a quarter (27.63%) of UK adults were living with obesity, ranking the UK 77th worldwide.
- Around one in three (32%) adults in Scotland were classified as obese in 2023. This is the highest rate among all nations.
- The North East has the highest obesity rate in the UK, with nearly four in ten adults (39%) living with obesity.
- Adults aged 55 to 64 are the most likely to be obese, with over one in three (36%) in this age group classified as obese.
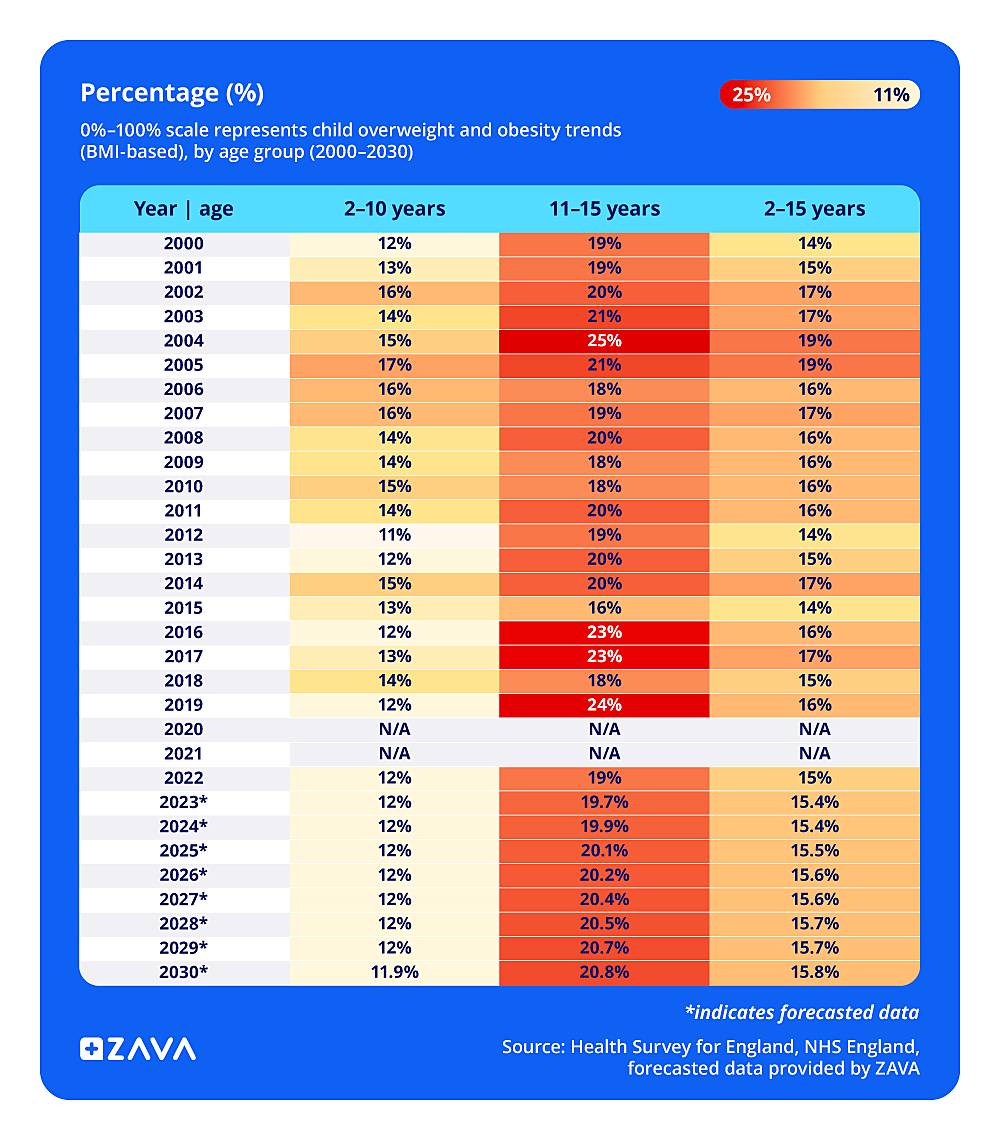
- Obesity is most common among children aged 11 to 15, with nearly one in five aged 11 to 12 (19%) and 13 to 15 (18%) living with obesity.
- More than half (55%) of adults living with obesity are more likely to experience depression than those in the general population.
- Children aged 11 to 15 are predicted to have the highest obesity rates among all child age groups, potentially reaching 20.8% by 2030, according to ZAVA forecasts.
- Adult BMI has steadily increased from 26.7 in 2000 to 27.4 in 2021, with projections from ZAVA indicating it could rise to 27.8 by 2030.
- People taking GLP-1 agonist injections may lower their risk of serious conditions like cardiac arrest and Alzheimer’s by up to 24%.
- Children living with obesity are noticeably taller than their healthy-weight peers, with an average height difference of around 3 to 5 cm in both Reception and Year 6.
Obesity statistics across the UK
Obesity rates in the UK, a high-income economy, reached 27.63% in 2022, placing the country 77th out of 200 in global rankings. This is lower than Australia, which ranks 58th, and the United States, which holds the 19th spot. However, it’s still high compared to many European countries, such as Germany (119th) and France (172nd).
The Office for Health Improvement and Disparities’ obesity profile estimates the rate to be slightly lower, at 26.5% for 2024, though this figure is presented as an estimate.
Unfortunately, busy schedules and reduced physical activity contribute to obesity levels across the UK. Eating habits have also changed, with increased access to convenience foods and fewer opportunities for regular exercise.
Obesity levels in the UK
The average adult weight in England has gradually increased over the years, reflecting shifts in lifestyle and health habits. According to the Health Survey for England, the lowest recorded average weight for adults in 1993 was 72.4kg. However, since then, there has been a steady rise, with small fluctuations along the way.

The highest recorded weight in this dataset was 79.3kg in 2022, reflecting a steady upward trajectory since the 1990s. For comparison, the average weight in 1993 was 72.4kg, meaning there has been a gain of nearly 7kg over three decades. This long-term increase highlights the growing prevalence of obesity in the UK and its continued rise in recent years.
This rise is most likely due to changes in lifestyle and the increasing availability of fast food, which typically has a higher calorie content and lower nutritional value, potentially contributing to weight gain. These trends help explain the growing rates of obesity in the UK and contribute to the concern around obesity in the UK as a public health issue.
Additionally, changes in work and lifestyle mean that many spend more time sitting, whether at desks or in front of screens, reducing opportunities for movement throughout the day. The Office for National Statistics (ONS) has reported that 44% of workers are working from home or in a hybrid arrangement. While the ONS data shows the change in remote working patterns, it is also important to consider how modern work habits are unintentionally shaping long-term health outcomes.
UK obesity rate projections and forecasting (incl. adults and children)
Obesity remains a challenge in the UK, but with the right support, many can take steps toward better health and well-being. Over the years, obesity levels have steadily risen, with adult BMI increasing from 26.7 in 2000 to 27.6 in 2022, with projections suggesting it may reach 27.8 by 2030. While these changes may seem small, even slight increases in BMI across the population can contribute to higher risks of health conditions like diabetes and heart disease.
For children, obesity rates have fluctuated, particularly among 11 to 15-year-olds, where the percentage has stayed around 20% or higher in recent years. The sharpest increases were observed between 2016 and 2019, representing the peak period before the COVID-19 pandemic. Interestingly, data shows a slight dip in obesity rates during the pandemic years of 2020 and 2021, especially among this age group. This may be due to changes in eating habits as well as shifts in daily routines during lockdowns. However, this improvement appears temporary, as rates are now creeping back up post-pandemic.
It’s estimated that 15.8% of children aged between two and 15 will be classified as obese by 2030. This is significant because childhood obesity can lead to long-term health struggles, making it harder to maintain a healthy weight in adulthood and increasing the likelihood of chronic illnesses.
Although these numbers point to a growing problem, they also serve as a reminder that small lifestyle changes can have a strong impact. Choosing healthier foods, finding simple ways to add movement to the day, and creating better awareness of how modern habits impact health can help slow down these rising trends.
UK obesity search volume trends and forecasting
Many people in the UK are thinking about their weight and health, and this is reflected in their online search activity. Ahrefs has found that phrases like "am I obese," "am I overweight," and "am I fat" have fluctuated over the years, reflecting public interest in body weight and health.
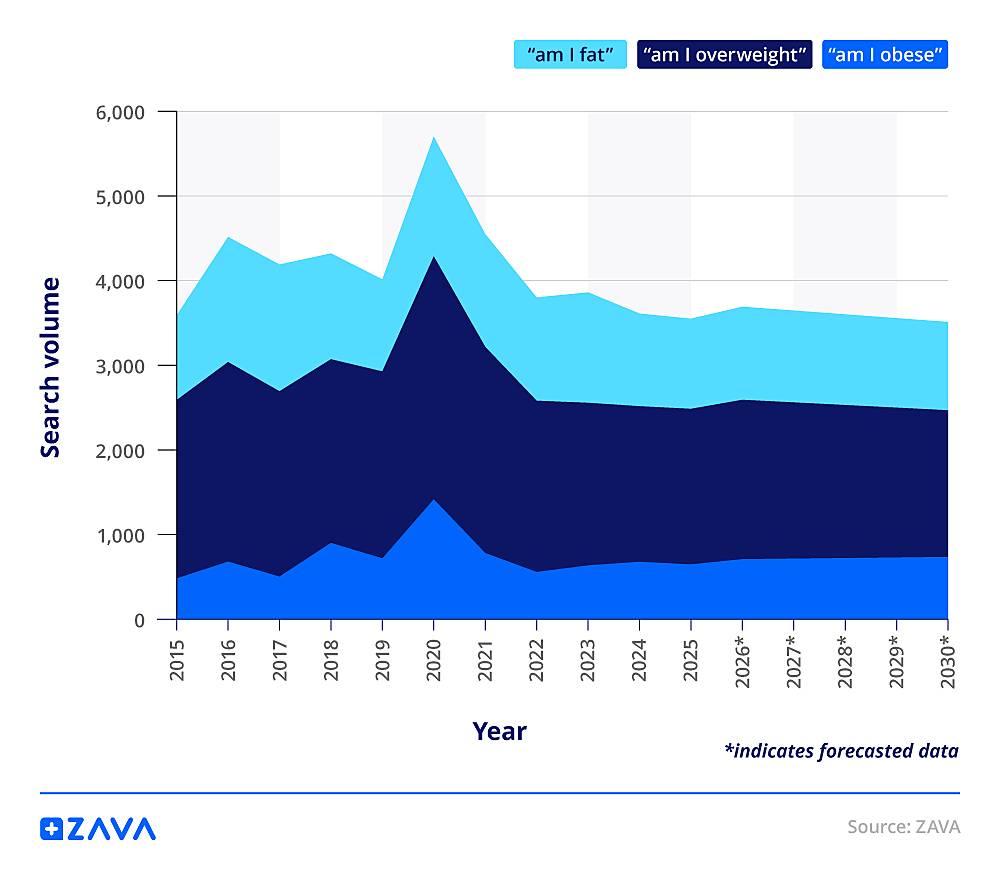
All three terms experienced noticeable spikes in 2020. This was likely influenced by the COVID-19 pandemic, which disrupted daily routines. During this time, searches for "am I obese" more than doubled compared to 2019, reaching 1,414.5 searches, while "am I overweight" peaked at 2,870.8 searches.
ZAVA forecasts indicate a gradual increase in searches from 2026 to 2030, with "am I obese" expected to rise from 709.1 in 2026 to 735.7 in 2030, and "am I overweight" projected to reach 1,732.6 by the end of the decade. However, these numbers remain below the 2020 peak. This suggests that fewer people may be turning to Google for guidance, potentially because more are managing their weight through medication, such as weight-loss injections or tablets, and by improving their diets. As access to weight-loss treatments increases, the need for self-diagnosis online could decrease.
Additionally, the phrase "am I overweight" consistently had the highest search volume, showing that more individuals are concerned about being slightly overweight rather than obese.
Obesity rates in the UK broken down by nation
Obesity rates vary across the UK, with Scotland having the highest percentage of obese adults at 32% in 2023. This is the highest level on record and is based on adjusted self-reported height and weight measures collected by the Scottish Government.
England recorded an obesity rate of just over one in four adults (28%) in 2022, showing that a significant portion of the adult population is affected. Although lower than in Scotland, the number remains substantial, suggesting a continued need for public health efforts to encourage healthier lifestyles. Obesity in England remains a major concern, particularly in urban areas, where inequalities may further impact health.
Northern Ireland had an obesity rate of 27.6% in 2023/24, closely following England. While slightly lower, this still points to a considerable health concern across the region, showing the need for initiatives focused on improving diet, physical activity, and overall well-being.

Finally, Wales reported that 27% of women and 25% of men are living with obesity, leading to an estimated overall adult obesity rate of 26% in 2022/23. This is the lowest percentage among all UK nations.
It should be noted that this data originates from the National Survey for Wales, which relies on self-reported information, similar to the Scottish survey. The figures show that a significant number of adults struggle with obesity in Wales, even though the percentage is lower than in other parts of the UK.
For broader context, the National Center for Health Statistics (NCHS) in the United States reported that between August 2021 and August 2023, 40.3% of American adults were living with obesity. This reflects a considerably higher prevalence compared to the UK. Meanwhile, in Europe, Eurostat’s 2019 European Health Interview Survey (EHIS) found that 16.5% of the EU adult population was classified as obese, showing that the UK nations remain above the EU average.
Obesity rates in the UK broken down by English region
The North East has the highest obesity rate at 39%; nearly four in 10 adults in the region are classified as obese. In the North West, about one-third (33%) of adults are obese, which is the same as the percentage who are overweight. When combined, 66% of adults in the North West are overweight or living with obesity, showing that weight-related health issues affect a significant portion of the population in the region.

London has the lowest obesity rate compared to other regions, with around one in five Londoners classified as obese, even though almost two in five adults are overweight. This indicates that while excess weight is common, fewer people in London live with obesity compared to other parts of the country.
This may be due to socioeconomic factors. London has a large population with higher incomes and education levels, which can contribute to slightly better health choices. Research suggests that obesity rates tend to be higher in more deprived areas, where access to healthy food and exercise opportunities may be more limited.
Obesity statistics by deprivation
Based on obesity statistics from the Office for Health Improvement and Disparities, being overweight is a concern in both the least and most deprived areas. In the least deprived decile, just under three-fifths (59.4%) of adults are overweight, including obesity, and around one in five (19.8%) of them fall into the obese category.
Residents in areas with higher median incomes often have better access to healthy foods, gyms, and private healthcare, which can help keep obesity rates lower. However, it's common for people to be overweight. This can be due to busy lifestyles, high-calorie diets, and stress. Many people in these areas work long hours in office jobs, leading to less physical activity.

In the most deprived decile, overweight levels rise to 71.2%, with 37.4% classified as obese. People in these communities may rely more on cheaper food options, which are often high in sugar and fat. Economic struggles and stress can also lead to emotional eating and unhealthy habits. Additionally, fewer recreational spaces and financial barriers can make it harder for individuals to stay active.
How is obesity measured in the UK
Obesity in the UK is measured using Body Mass Index (BMI), which calculates your weight in relation to your height. This helps determine whether you fall into a specific weight category. A BMI between 18.5 and 24.9 is considered a healthy weight, showing that your weight is in a good range for your height.

If you have a family background that is South Asian, Chinese, the Middle Eastern, Black African, or African-Caribbean, a lower BMI threshold is applied. In this case, a BMI between 23 and 27.4 is considered overweight, and 27.5 or above is classified as obese. This is because research indicates that people from these backgrounds may face higher health risks at lower BMI levels.
It’s also important to remember that BMI has limitations. It measures whether a person is carrying too much weight, but not necessarily too much fat. For example, individuals with high muscle mass (e.g. professional athletes) may have a high BMI while having very little body fat. Therefore, BMI should be used as a general guideline, and it's better to consult a healthcare professional, as they can provide an accurate picture of your overall health.
Obesity statistics across the globe
According to the World Obesity Atlas 2025, overweight and obesity are responsible for around 1.6 million early deaths each year from conditions like diabetes, cancer, heart disease, and stroke. That’s more than the number of people who die in road accidents.
Obesity rate breakdown by country
American Samoa has the highest obesity rate in the world, exceeding 70%. Tonga and Nauru rank 2nd and 3rd, meaning all three countries have more than seven in 10 people living with obesity. This is largely due to a shift from traditional diets to cheap and imported processed foods high in refined carbs and fat.
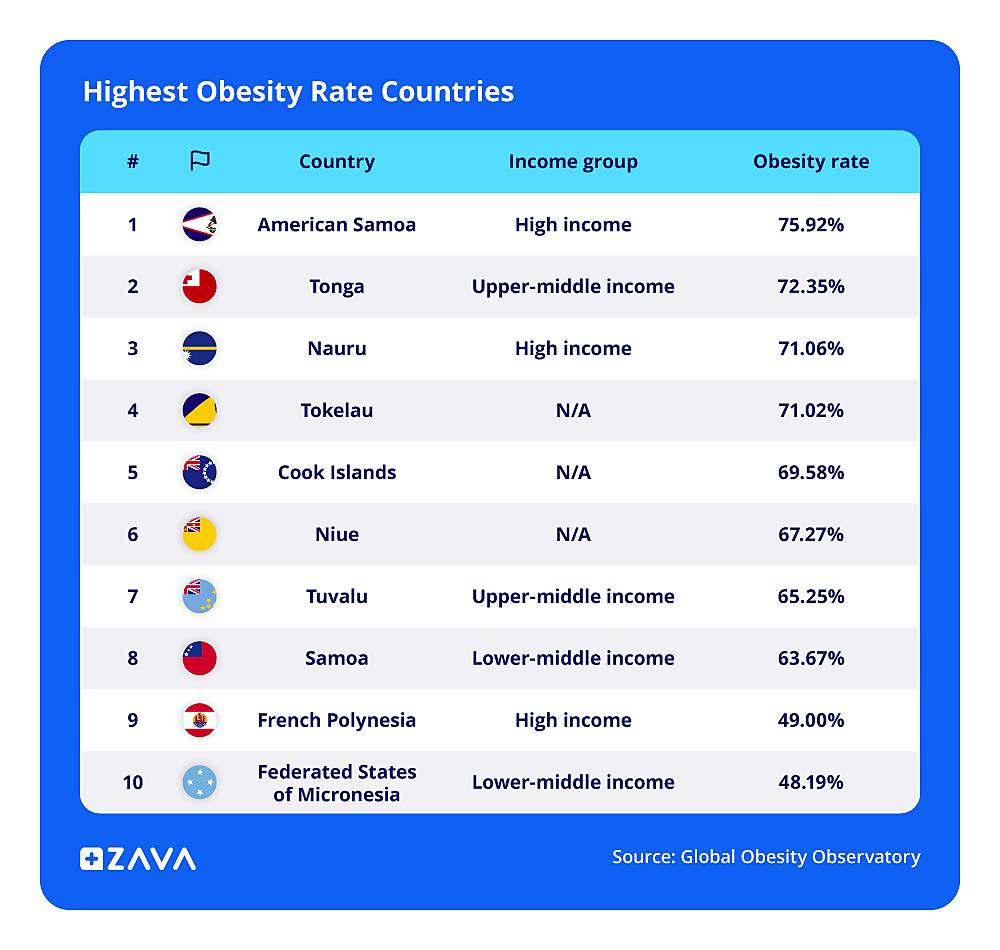
Additionally, these high obesity rates are closely tied to serious health problems. In American Samoa alone, over 30% of adults have type 2 diabetes, which is more than three times the U.S. average. Tonga has a proportion of 19.6% of adults with diabetes, while Nauru has the highest in the world, with slightly less than half (40%) of adults affected and almost all men (97%) classified as overweight.
At the other end of the scale, the countries with the lowest obesity rates in the world include Vietnam (2.04%), Timor-Leste (2.41%), and Ethiopia (2.90%).

All three are lower-middle or low-income nations, where traditional diets, limited access to processed foods, and more physically active lifestyles likely contribute to these low figures. These rates contrast sharply with the levels seen in places like American Samoa and Nauru, highlighting global disparities in nutrition and health outcomes.
UK obesity rates by demographic breakdown
Obesity statistics by age group
According to the Commons Library data, people aged 55 to 64 are the most likely to be obese, with over one in three people (36%) classified as obese. This is followed closely by the 65 to 74 group at 35%. As we get older, our metabolism naturally slows down, and the body burns fewer calories. This makes it easier to gain weight and harder to lose it.

In contrast, the 16 to 24 age group is the least likely to be overweight, with about one in seven classified as obese. This is because younger adults tend to be more active and have faster metabolisms, making it easier to maintain a healthier weight. With fewer health issues and less pressure from work or family life, they are often able to maintain their weight without too much focus.
Obesity statistics by gender
The most recent data shows that almost seven in 10 men (69.7%) are overweight compared to just over half of women (59.2%), indicating that being overweight is more common among men.
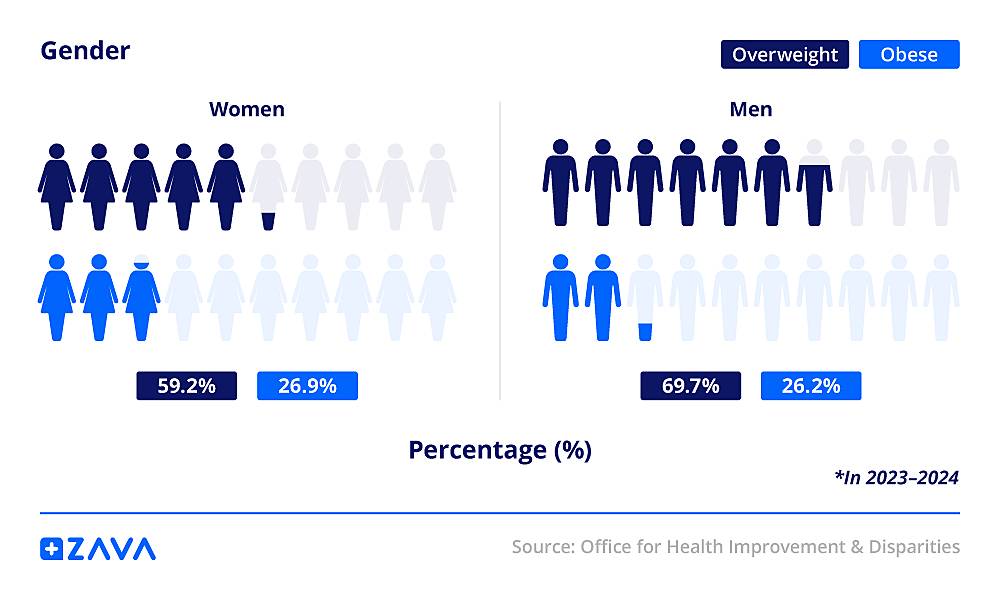
However, obesity rates are nearly the same, with 26.2% of men and 26.9% of women recorded as obese. This suggests that although more men are overweight, women are slightly ahead when it comes to obesity. These male vs female obesity rates in the UK highlight the importance of gender-specific strategies in tackling weight-related health issues.
Overweight and obesity statistics by ethnicity
The data provided by the Department of Health and Social Care has shown that overweight and obesity rates vary a lot between different ethnic groups in the UK.
The highest rate is among Black individuals, with nearly three-quarters, followed by just under two-thirds of White British. These figures offer insight into the complex relationship between obesity and ethnicity within the country.
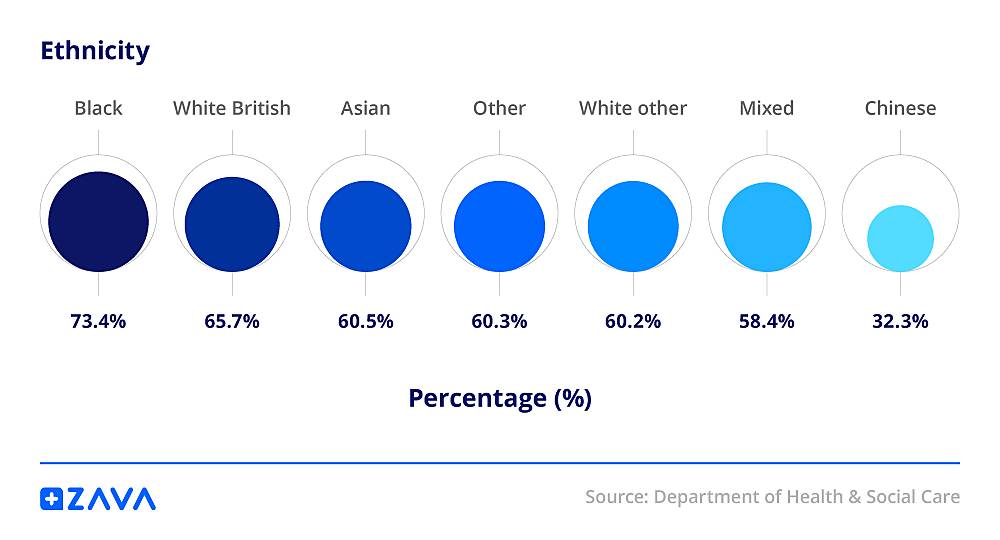
Other groups, including Asian and mixed ethnicities, have lower rates, and Chinese individuals have the lowest at 32.3%. This may be linked to cultural values and social factors. In Chinese communities, being slim is often seen as a beauty standard. Cultural observations suggest this perception may influence lifestyle choices and encourage healthier habits. However, it can also sometimes promote unrealistic and potentially harmful weight ideals.
On the other hand, according to the Office for National Statistics, the higher rate among Black individuals may be affected by income inequality, which can limit access to higher education, well-paid jobs, and opportunities that support long-term health. These patterns suggest that obesity is shaped more by the environment and circumstances in which people live than by personal choice.
UK childhood obesity statistics
Childhood obesity levels continue to rise across the UK, with more children impacted each year. It’s a complex issue with many causes, including social and regional aspects, making it more important than ever to understand how and where obesity affects young people.
Childhood obesity statistics by region
According to NHS England Digital, childhood obesity tends to rise as children get older. In every region, more children in Year 6 are classed as obese compared to those in Reception, suggesting that unhealthy habits can build up during the primary school years.

The North East is the most affected, with around one in 10 Reception children (10.8%) and one in four Year 6 children (24.5%) living with obesity. The West Midlands and Yorkshire and the Humber are also among the regions with the highest rates. On the other hand, the South West and South East have the lowest rates, with fewer than one in 10 Reception children (under 9%) and about one in five Year 6 children (around 19%) impacted.
The data makes it clear that childhood obesity is a growing problem in many parts of the country, and there’s no single solution. Some regions might benefit more from localised support that truly fits their communities.
Childhood obesity statistics by age group
The highest obesity rates are seen in children aged 11 to 12 (19%) and 13 to 15 (18%), closely followed by the 8 to 10 group at 16%. This suggests that as children grow older, especially during the later years of primary school and the start of secondary school, the risk of obesity increases.

At this stage, children often gain independence, face greater exposure to unhealthy food options, and become less active due to screen time and academic pressure. These patterns may reflect the early development of habits that are harder to change over time. The levels of obesity being higher than overweight in older children also suggest that those who are struggling might not be getting support early enough to make a lasting difference.
Childhood obesity statistics by gender
The recent data has shown that childhood obesity is more common among boys. Nearly one in 10 boys (9.3%) are living with obesity in Reception. By Year 6, this rises to 25.1%, with 6.8% classed as severely obese. This is a significant increase in just a few years, suggesting that early support and healthier habits could make a meaningful difference as children grow.
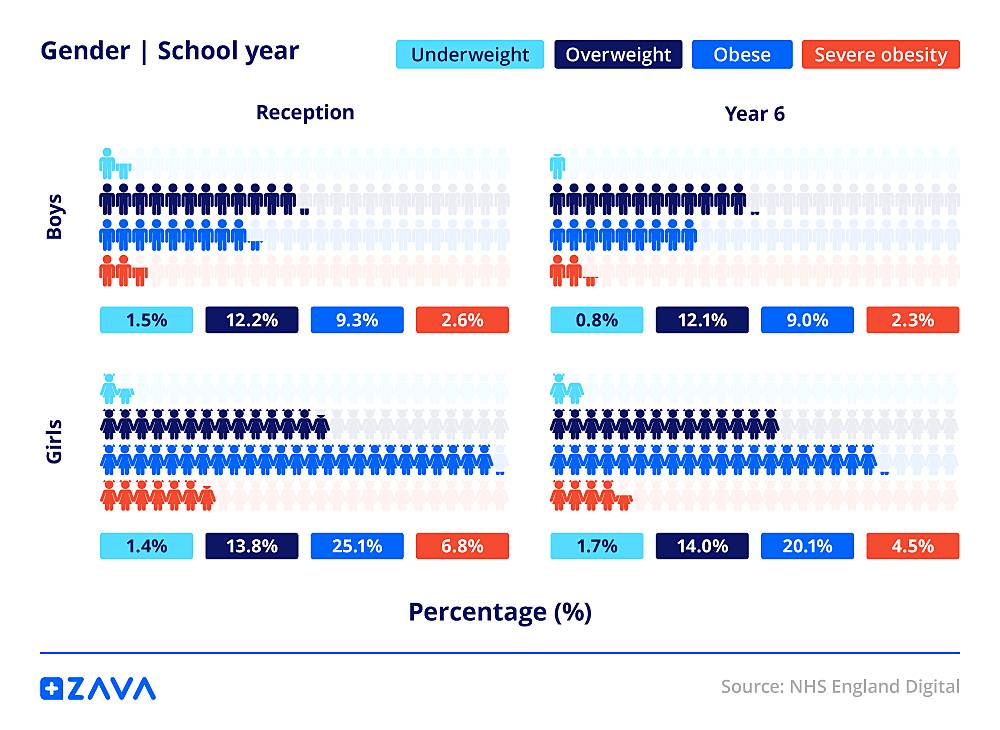
Girls also see a rise in obesity levels as they get older, though the numbers are slightly lower. In Reception, around 9% are living with obesity, rising to one in five by Year 6 (20.1%). Severe obesity increased from 2.3% to 4.5%. These figures remind us how important it is to create a supportive environment for all children to eat well, stay active, and feel good about their health.
Childhood obesity statistics by ethnicity
Childhood obesity statistics by ethnicity reveal clear differences across groups. For instance, Black ethnic backgrounds have the highest obesity rates, with around one in seven in Reception (13.6%) and nearly one in three in Year 6 (31.6%). This is well above the national average of 9.2% and 22.7%. This difference may be in part due to lower BMI thresholds applied for some ethnic groups, reflecting higher health risks at lower BMI levels. However, this gap may also point to deeper social and environmental factors.

Asian (8.8%) and White children (8.9%) are closer to the average, though rates in Year 6 remain high at 25.8% and 21.4%, respectively. Children from Chinese backgrounds have the lowest obesity levels, with just over 4% in Reception, and 15.2% in Year 6. This highlights the need for culturally sensitive support, as every community has its own traditions and day-to-day challenges.
Average height for children (obese vs healthy weight)
Among five-year-olds, the 2023-2024 data points to a trend where children with a higher BMI category also tend to be taller. Boys with obesity have an average height of 113.2cm, compared to 109.8cm for those at a healthy weight.
A similar difference is seen in girls, with those living with obesity averaging 112.5cm in height, while girls at a healthy weight average 108.7cm. This may suggest that children with higher body weights often grow taller at an earlier age.

In Year 6, the same pattern continues. Boys with obesity reach an average height of 149.9cm, while boys at a healthy weight average 144.9cm. In contrast, girls with obesity are on average 151.1cm tall, compared to 146.2cm for girls with a healthy weight. Again, children with higher BMI levels tend to be taller than their peers.
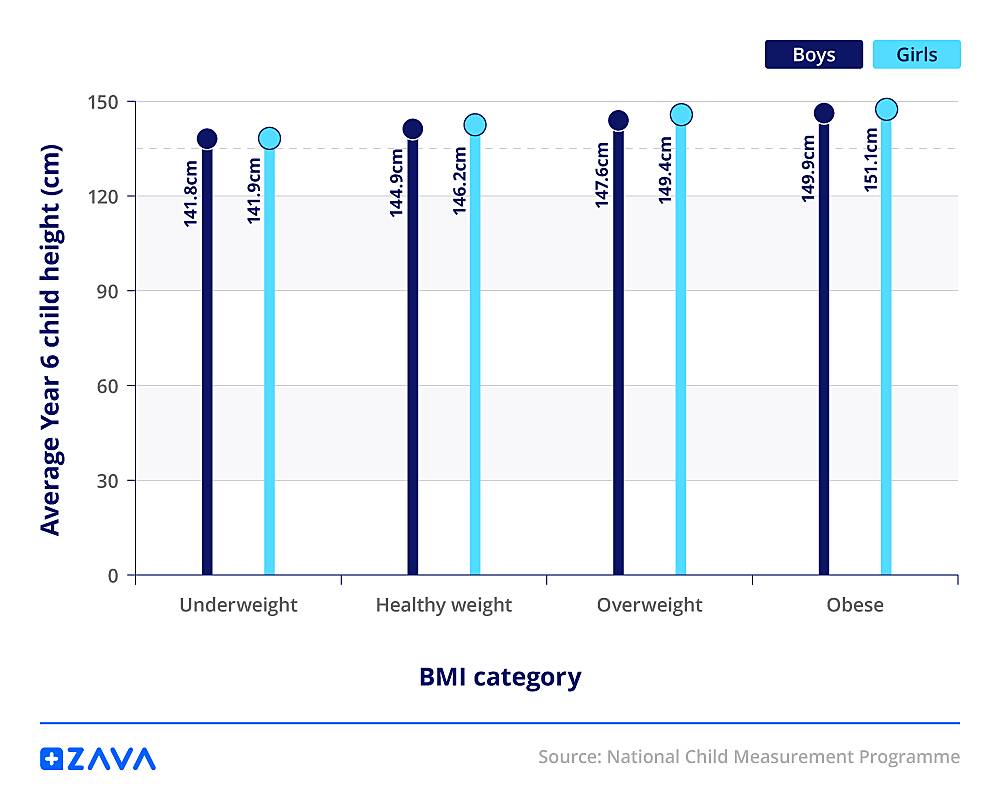
Looking at both age groups together, it becomes clear that children with obesity are generally taller than those with a healthy weight. While height alone is not a concern, this data on the average height for children may point to early physical development associated with higher body weight.
Health impacts of obesity
There are many health risks of obesity, including physical health problems such as diabetes, high blood pressure, or heart disease. But obesity can also affect mental health, contributing to issues like depression, low self-esteem, and the long-term effects of weight stigma.
Physical health impact and statistics of obesity
Obesity-related health risks depend on both BMI and waist size. For those within a healthy BMI range (18.5 to under 25), the risk stays low regardless of waist measurement. However, as BMI rises, a larger waist can signal a greater risk. This shows the physical impact of obesity on overall health.
People who are overweight (BMI 25 to under 30) may face higher risks if they also have a high or very high waist size. This trend continues for those in the Obesity I group (BMI 30 to under 35), where risk increases as waist size grows.

Health professionals are encouraged to check waist size alongside BMI for anyone under a BMI of 35. This is because some people may carry more fat around their stomach, which raises the chance of developing conditions such as type 2 diabetes (even if their BMI alone seems moderate). Once someone has a BMI of 25 or more, their risk is already very high, and waist size doesn’t add much more to the overall picture.
Mental health impact and stigma statistics of obesity
Adults living with obesity are 55% more likely to experience depression compared to the general population. Research from BMC Public Health also found that individuals with a history of depression had higher BMI, body fat percentage (BFP), fat mass, fat-free mass, and waist-hip ratios than those without depression. This suggests that obesity and mental health are closely connected, with obesity potentially affecting long-term emotional well-being.

Separate findings from Bristol University’s Children of the 90s study show the lasting stigma of obesity. Although one in four people lives with obesity in England, many face negative stereotypes and discrimination. These experiences can lead to poor mental health, eating disorders, and delays in seeking treatment. This further underlines how obesity and mental health can influence each other throughout life.
The study, based on over 4,000 participants, found that pressure from family and media influence during teenage years was linked to higher levels of internalised weight stigma by age 31, regardless of BMI. Bullying in adolescence and early adulthood also contributed to these lasting effects.
Obesity and average life expectancy statistics
According to research on obesity statistics, class 3 obesity is defined as having a BMI of 40 or higher. It significantly raises the risk of conditions such as heart disease and can shorten life expectancy by up to 14 years. For those with severe obesity, losing weight can improve both quality of life and average life expectancy.
The NHS also states that obesity can reduce life expectancy by an average of 3 to 10 years, depending on how severe it is. The average age of death for an obese person can vary, but studies suggest that this may differ based on gender. For example, the average life expectancy of an obese female may be affected differently compared to obese males, depending on lifestyle and underlying conditions.
Causes of obesity
The causes of obesity include more than just diet or exercise. In the UK, a mix of lifestyle habits, medical conditions, and genetic causes of obesity has made it increasingly common across all age groups.
What are the leading causes of obesity in the UK
Obesity happens when the energy you consume regularly exceeds the energy you use up. According to NICE, several key factors contribute to this imbalance:
- Lifestyle - Regularly eating high-calorie foods, drinking sugary drinks, and spending long periods sitting down can lead to weight gain over time. Many people also face barriers to being more active, such as a lack of time or safe spaces to exercise.
- Genetics - Some people are more likely to gain weight due to inherited traits. One example is the 'ob' gene, which controls the production of leptin. Leptin is a hormone sometimes called the satiety hormone because it helps signal when we are full. In some cases, the body may become resistant to leptin, meaning it no longer sends strong signals of fullness.
- Medical conditions - Certain health conditions, like an underactive thyroid (hypothyroidism) or Polycystic Ovary Syndrome (PCOS), can make weight gain more likely and weight loss more difficult.
- Medications - Some prescription drugs can lead to weight gain as a side effect. These include medications for mental health conditions, epilepsy, and long-term steroid use.
- Other risk factors - Poor sleep, high levels of stress, limited access to healthy food, and social or economic challenges can also influence weight. For example, people living in deprived areas may have fewer opportunities for exercise or healthy eating.
Obesity in the UK cannot be explained by personal choices alone. This is why understanding these causes can help support more thoughtful and compassionate public health strategies.
Causes of childhood obesity
Children, like adults, are likely to gain weight if they consume more energy than they spend. If a child is obese, it could be due to a combination of:
- Eating sugary drinks and foods that are high in fat
- Having portions that are larger than needed
- Not being physically active enough
- Spending long periods sitting (e.g., watching television)
- Not getting enough sleep
Being overweight can also run in families. If a child is overweight, their parents often are too. This may be partly genetic, but can also reflect shared eating habits and activity levels within the household.
According to the NHS, eating disorders were four times more common in girls than boys aged 11 to 16 in 2023, with 4.3% of girls affected compared to just 1.0% of boys.
Causes of obesity by gender
Hormonal differences between men and women can influence how obesity develops. Women generally have more fat tissue than men and tend to store it around the hips and thighs, while men are more likely to carry fat around the stomach.
This is partly due to the way fat cells respond to different hormones. Subcutaneous fat contains more oestrogen and progesterone receptors. Visceral fat, on the other hand, has more androgen receptors. These differences in fat storage and body composition help explain how obesity can affect genders in different ways.
Hormones may also shape eating habits, with research suggesting that women are more likely to prefer sweet and carbohydrate-rich foods, whereas men often choose foods higher in fat.
Obesity treatment statistics
The NHS spends around £6.5 billion each year on obesity-related care. That’s why obesity treatments are becoming more varied and accessible across the UK, allowing more people the chance to find support that works for their needs and long-term health.
Weight loss injection statistics

Weight-loss injections such as Wegovy and Mounjaro are not only effective for reducing appetite and supporting weight management, but they also offer a range of additional health benefits. Wegovy weight loss injections can help people lose up to 15% of their starting body weight, while Mounjaro weight loss injections may lead to weight loss of up to 22.5%. This makes them powerful options for those seeking effective treatment.
Recent research supports these benefits. In a large study involving over 2.4 million people, researchers compared those taking GLP-1 agonist injections with individuals on standard diabetes medication. The results showed a 22% lower risk of cardiac arrest and a 9% lower risk of heart attack among those using the injections. They also had a 12% lower risk of developing Alzheimer’s disease and a 24% lower risk of liver failure.
For information, please visit our page about weight loss injections and tablets.
We're also happy to offer expert support and guidance if you need it.
Weight loss surgery statistics

Weight-loss surgery is often recommended as a first-line treatment for patients with a BMI of 50 or more due to the serious health risks that come with severe obesity. In England, around 6,000 to 7,000 bariatric procedures are carried out each year through the NHS.
Additionally, an estimated 5,000 surgeries are performed annually in the private sector, either within the UK or overseas. These figures reflect the increasing reliance on surgical interventions to help manage obesity and improve long-term health outcomes.
Behavioural therapy for weight loss statistics
Behavioural therapy can be an effective tool for weight loss when delivered through structured programmes. A meta-analysis of treatment plans offering between 13 and 52 sessions found that after one year, one in four participants (28%) lost 10% or more of their initial body weight, and another one in four (26%) lost between 5% and 9.9%. However, just over one in three (38%) lost less than 5%.
These results show potential, although long-term maintenance can be challenging. Patients typically regain about one-third of the lost weight within a year after treatment ends, and nearly half return to their original weight within five years.
Dieting statistics
NHS data shows that hospital treatments for obesity have increased more than fourfold over the past decade, rising from about 442,000 in 2014 to nearly 1.9 million in 2024. One programme supporting people in managing their weight is the NHS Digital Weight Management Programme, which offers a 12-week online plan focused on practical dietary advice.

In its first year, over 63,000 people were referred, with half enrolling and more than 14,000 completing the full programme. Those who completed it lost an average of 3.9kg, while the average weight loss across all participants who started was 2.2kg.
With easy access through a smartphone or computer and no need to attend in-person sessions, the programme supports people in making sustainable dietary changes that fit into everyday life.
Obesity statistics FAQs
How many people are obese in the UK?
As of 2022, 27.63% of people in the UK were living with obesity, which adds up to around 18.7 million people. That’s just over a quarter of the population. The UK ranked 77th in the world out of 200, showing that obesity is a widespread issue that affects millions across the country.
What country has the highest obesity rate?
As of the most recent data, American Samoa has the highest obesity rate in the world, with an estimated 75.92% of its population classified as obese. This small Pacific Island nation has seen a major shift from traditional diets to processed, imported foods high in fat and sugar, which has contributed to its extremely high rates of obesity and related health issues, such as type 2 diabetes.
How much does obesity increase the risk of heart disease?
Obesity has a big impact on heart health. According to the Framingham Heart Study, for every small increase in BMI, the risk of heart failure goes up by 5% in men and 7% in women. The longer someone is obese, the greater the risk becomes. After 20 years, 70% of people with severe obesity may develop heart failure, and after 30 years, it can rise to 90%.
How is obesity diagnosed?
It’s done by calculating your Body Mass Index (BMI), which is based on your height and weight. A BMI of 30 or above is usually considered in the obese range.
To gain a better understanding of your overall health, your GP may also carry out additional checks. These can include measuring your blood pressure, taking a blood sample to check glucose and cholesterol levels, and assessing your waist circumference.
What is the average BMI in the UK?
The latest available data from 2022 shows that the average BMI for both men and women in the UK was 27.6, which falls into the overweight range. BMI generally increases with age, starting lower in younger adults and rising as people get older.
How much does obesity cost the NHS?
Obesity costs the NHS around £6.5 billion each year, placing a significant strain on healthcare services. It’s also the second-biggest preventable cause of cancer after smoking.
How does being overweight affect fertility?
Being overweight can have a noticeable impact on fertility for both men and women. In women, having a BMI of 30 or above can impact ovulation, making it more difficult to conceive. Fertility can also be reduced if a woman is severely underweight.
According to the NHS, around one in seven couples experience difficulty getting pregnant. However, more than eight out of 10 couples where the woman is under 40 will conceive naturally within a year if they have regular unprotected sex. Maintaining a healthy weight can support the chance of conception and overall reproductive health.
What are the top 5 facts about obesity?
- As of 2022, over one in four adults in the UK are obese, which equals around 18.7 million people.
- Obesity costs the NHS around £6.5 billion each year
- It’s the second-biggest preventable cause of cancer
- More men are overweight, but slightly more women are obese, with a 0.7% difference in obesity rates.
- Obesity increases the risk of heart disease by 5% in men and 7% in women.
Why is the UK’s obesity rate so high?
The UK is one of the heaviest countries in Europe, with obesity rates reaching 27.63% in 2022, placing it 77th out of 200 in the global rankings. This is still high compared to other European countries like Germany, which ranks 119th, and France at 172nd.
A big reason for this is lifestyle. People in the UK tend to drink more fizzy drinks, eat fewer vegetables, and exercise less than those in many other countries. Combined with easy access to processed foods and busy routines, these habits continue to fuel the country's obesity problem.
How many people will be obese by 2030?
According to the World Obesity Atlas 2022, published by the World Obesity Federation, it’s predicted that by 2030, one billion people will be living with obesity. This includes one in five women and one in seven men.
Sources
- https://www.gov.uk/government/statistics/update-to-the-obesity-profile-on-fingertips/obesity-profile-short-statistical-commentary-may-2024
- https://data.worldobesity.org/rankings
- https://view.officeapps.live.com/op/view.aspx?src=https
- https://www.ons.gov.uk/employmentandlabourmarket/peopleinwork/employmentandemployeetypes/articles/characteristicsofhomeworkersgreatbritain/september2022tojanuary2023
- https://digital.nhs.uk/data-and-information/publications/statistical/health-survey-for-england/2022-part-2/adult-overweight-and-obesity
- https://www.gov.uk/government/statistics/obesity-profile-may-2025-update/obesity-profile-short-statistical-commentary-may-2025
- https://www.nhs.uk/conditions/obesity/
- https://human-resources-health.biomedcentral.com/articles/
- https://idf.org/our-network/regions-and-members/western-pacific/members/tonga/
- https://www.diabetes.co.uk/in-depth/i-have-seen-so-many-funerals-for-such-a-small-island-the-astonishing-story-of-nauru-the-tiny-island-nation-with-the-worlds-highest-rates-of-type-2-diabetes/
- https://fingertips.phe.org.uk/search/obesity
- https://digital.nhs.uk/data-and-information/publications/statistical/national-child-measurement-programme/2023-24-school-year/geography
- https://www.gov.uk/government/statistics/obesity-profile-february-2025-update/obesity-profile-statistical-commentary-on-patterns-and-trends-in-child-height-february-2025
- https://bmcpublichealth.biomedcentral.com/articles/10.1186/
- https://www.bristol.ac.uk/news/2024/april/weight-study.html
- https://www.healthline.com/health/obesity/class-3-obesity-life-expectancy
- https://www.nhs.uk/conditions/obesity/
- https://cks.nice.org.uk/topics/obesity/background-information/causes-risk-factors/
- https://www.bupa.co.uk/health-information/childrens-health/overweight-children
- https://digital.nhs.uk/data-and-information/publications/statistical/mental-health-of-children-and-young-people-in-england/2023-wave-4-follow-up/part-5-eating-problems-and-disorders
- https://pmc.ncbi.nlm.nih.gov/articles/PMC10859324/
- https://www.zavamed.com/uk/weight-loss-treatment.html
- https://www.bhf.org.uk/informationsupport/heart-matters-magazine/news/behind-the-headlines/weight-loss-injections
- https://www.hweclinicalguidance.nhs.uk/clinical-policies/bariatric-surgery/
- https://pmc.ncbi.nlm.nih.gov/articles/PMC3233993/
- https://www.england.nhs.uk/2024/04/nhs-online-weight-loss-programme-highlighted-as-a-success-in-new-study/
- https://academic.oup.com/eurjpc/article/31/8/1026/7578360?login=false
- https://human-resources-health.biomedcentral.com/articles/10.1186/s12960-019-0356-6
- https://www.nhs.uk/conditions/obesity/diagnosis/
- https://healthmedia.blog.gov.uk/2023/06/07/government-plans-to-tackle-obesity-in-england/
- https://www.nhs.uk/conditions/infertility/
- https://www.bbc.co.uk/food/articles/britain_diet
- https://www.worldobesity.org/news/one-billion-people-globally-estimated-to-be-living-with-obesity-by-2030
- https://www.gov.uk/government/statistics/obesity-profile-may-2025-update/obesity-profile-short-statistical-commentary-may-2025
- https://www.bbc.co.uk/programmes/articles/2z3kQLB613gsLkQWf36306V/is-2025-the-year-we-fix-obesity
- https://studycli.org/chinese-culture/chinese-standards-of-beauty/
- https://www.ons.gov.uk/employmentandlabourmarket/peopleinwork/earningsandworkinghours/articles/ethnicitypaygapsingreatbritain/2012to2022